Your first backtest
Build a portfolio, pick the period and read the results.
A backtest answers one precise question: if I had invested in this portfolio over this period, what would have happened? In five minutes we'll build the most classic portfolio there is (60% stocks, 40% bonds) and read the result.
1. Build the portfolio
The search bar sits in the top panel of the home page. Search for an asset by name or ISIN (a global equity ETF, say) and pick it from the dropdown.

Set the allocation percentage and hit Add. The asset appears in the composition table below. Repeat for the second instrument (a bond ETF) with the remaining weight.
Weights must sum to 100%. If they don't, the run button tells you before you start.
Two shortcuts worth knowing. If your weights don't add up to 100% yet, a Percentage to allocate bar appears below the table with an Auto distribution button: it rescales your existing holdings to hit exactly 100%, keeping their proportions to each other.
And if the portfolio is already full and you try to add one more asset, the Add button turns into Make space & add: click it and the existing holdings shrink proportionally to make room for the new one, instead of blocking you.


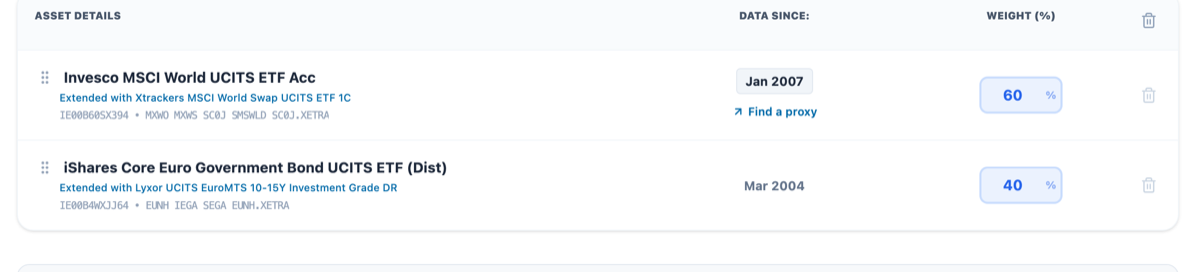
One detail that matters: prices are net of TER but exclude dividends. Irrelevant for accumulating products; for distributing ones your real return would have been higher. See Where the data comes from.
2. Choose the period
Below the composition table you'll find the Analysis period bar, with a calendar icon and the current range written as from → to. It's a dedicated control, not an entry inside the settings.
By default the period already covers all available history, so for a first analysis there's nothing to change: the longest possible period is exactly what makes a backtest informative.
To narrow it, click the range. A panel opens showing From, To and the Span in years in large type, and below that two ways to change them:
- The two sliders over a preview of the price path, so you can see which slice of history you're selecting as you drag.
- The row of shortcuts at the bottom:
1Y,3Y,5Y,10Yand Max. Spans longer than the available history are hidden, and Max always returns to the full range. The active shortcut stays highlighted.
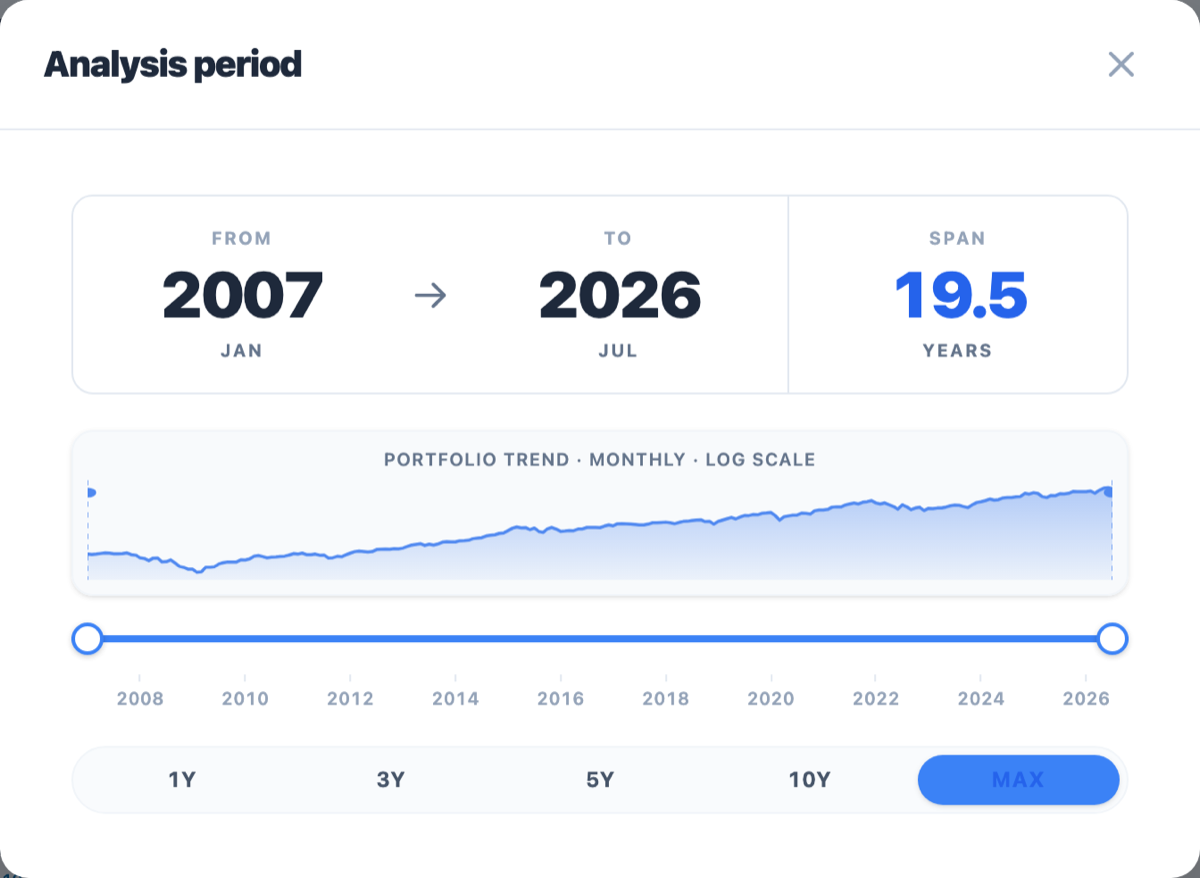
Once the panel is closed, the bar reminds you whenever the period is shorter than the maximum: the largest available range appears next to the current one, along with a Reset button that restores the full history without reopening the panel.
The engine works monthly, using end-of-month values, so the endpoints are interpreted as whole months.
Narrow the period when you want to isolate an event (2008, 2020, 2022) and see how the portfolio would have behaved at that precise moment.
If the bar shows a Limited by warning, the period isn't your choice: an instrument with shorter history is setting the start date. Clicking the warning jumps straight to that instrument.
3. Set the strategy
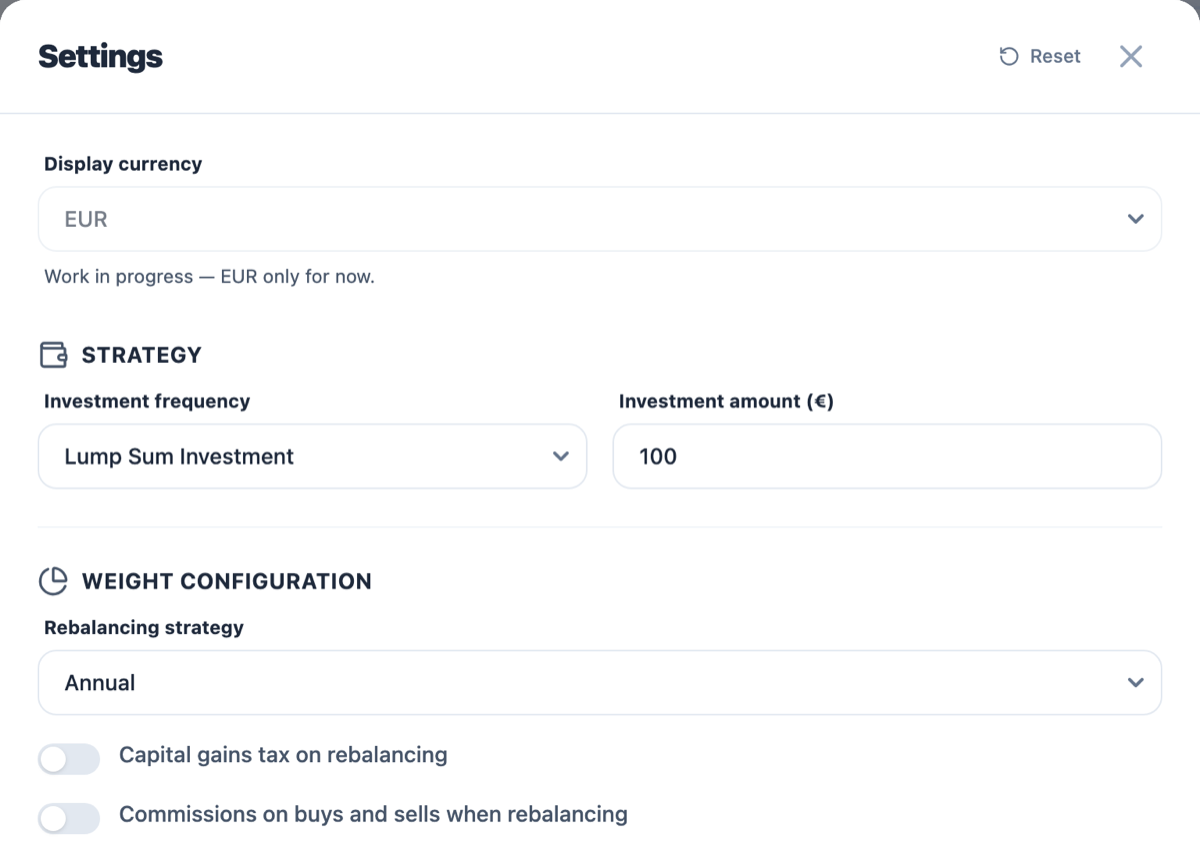
Open Settings: in the Strategy card, the Investment frequency menu decides how money goes in.
- Lump Sum Investment: one amount invested at the start and never touched. The cleanest way to measure the strategy itself, without contribution timing muddying the result.
- Monthly, quarterly, semi-annual or annual investment: recurring contributions, that is, a DCA plan. More realistic, but it changes what "return" means, see Simulating a DCA plan.
The amount goes in the Investment amount (€) field next to it.
The Weight Configuration card decides, via Rebalancing strategy, how often the portfolio returns to its target allocation. Leave it on Annual for a first run: it's the most common compromise between cost and precision. More on this in Rebalancing.
4. Run it and read the results
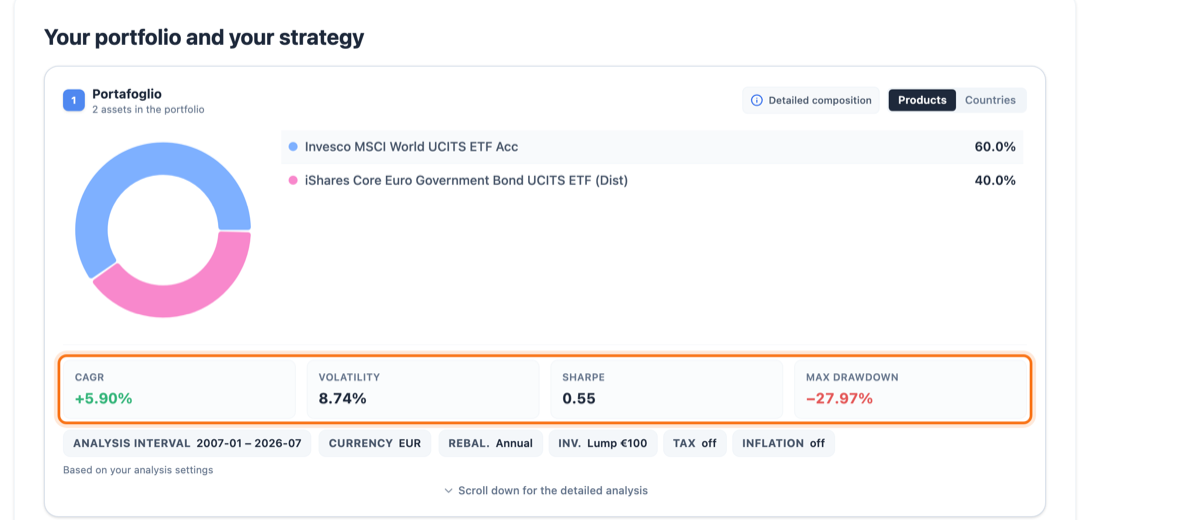
Hit Run Backtest. Results are organised in tabs; for a first read four numbers are enough, all in the dashboard at the top of the Performance tab.
| Metric | What it tells you |
|---|---|
| CAGR | Compound annual growth rate. The number that answers "how much did it return". |
| Volatility | How much returns swing. The number that answers "how uncomfortable was it". |
| Sharpe | Return per unit of risk, against Euribor. Useful for comparing portfolios. |
| Max Drawdown | The worst fall from a previous peak. The number that tells you whether you'd have held on. |
Practical advice: read Max Drawdown before CAGR. You only collect the return if you stay invested, and you only stay invested if the worst loss is bearable for you. A portfolio returning 8% that fell 55% is a portfolio many people would have sold at the bottom.
What to look at next
- Drawdown: how deep the falls were and how long recovery took.
- Rolling returns: return over moving windows, far more honest than the return of the single period you happened to pick.
- Return distribution: histogram with median and lines at ±1σ, ±2σ, ±3σ.
- Dani Score: a quick diagnosis across Performance, Diversification, Risk and Simplicity.
Once a single portfolio makes sense, the next step is putting it against another: Comparing two portfolios.