Planning for FIRE
From savings rate to your financial independence date.
FIRE stands for Financial Independence, Retire Early: accumulating enough capital to live off your investments. The Backtes.to simulator doesn't hand you a hard date, and for good reason: it gives you a probability of success, the only honest answer to a question that depends on future markets.
1. Start from a real portfolio
The FIRE simulation doesn't use a made-up average return: it samples the real historical returns of your portfolio. So the first step is having a portfolio, with its weights and its rebalancing frequency, exactly as for a backtest.
Go to FIRE and set the composition. The rebalancing you choose here is what builds the historical return series the projection then works on.
2. Draw your life line
Three fields define the time axis:
- Current age: the starting point.
- FIRE age: when you stop working. This is when the portfolio switches from accumulation to withdrawal.
- Simulation end: either a fixed age shared by all simulations, or left stochastic: lifespan is sampled from Italian ISTAT mortality tables, and every simulation runs a different length.
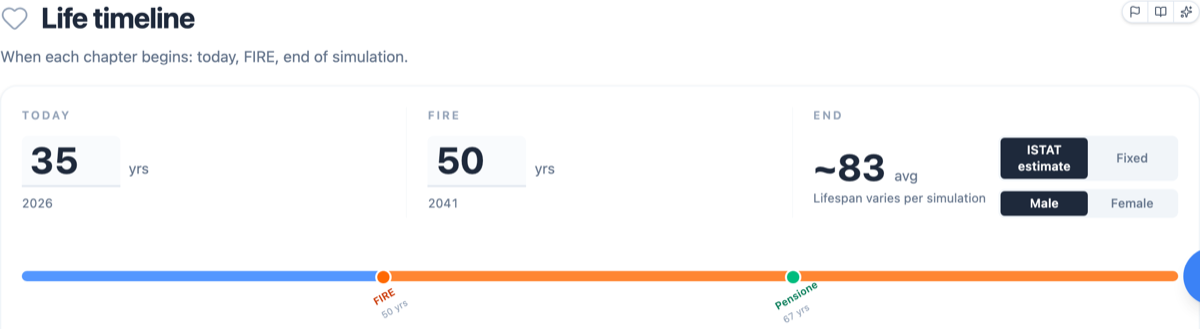
Stochastic is more realistic. A fixed horizon at 95 makes you plan for a scenario you'll statistically rarely live, and overstates the capital you need.
3. Enter capital, inflation and cash flows
Starting capital is what you already have invested today.
Inflation can be a fixed value, or Italian historical inflation sampled from ISTAT data, which reflects the real variability of prices. It revalues expenses and all indexed items year after year.
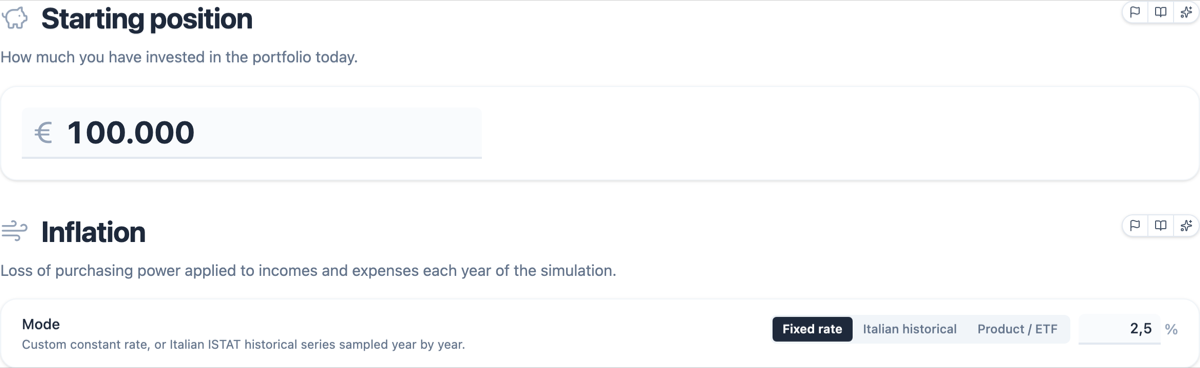
Everything else (contributions, salary, pension, recurring expenses, one-off expenses) goes in as rows in the "Income and expenses" table. Each row has an amount, a frequency (one-off or recurring), a from/to period and inflation indexation.
The period is the expressive part: a row can start immediately, at a specific age or at the FIRE year, and end at an age, at the FIRE year, or run for life. Those two fields model practically any cash flow:
| Situation | How to set it up |
|---|---|
| Contributions until retirement | Income, recurring, now → FIRE year |
| State pension from 67 | Income, recurring, age 67 → for life |
| Mortgage payment for 12 years | Expense, recurring, now → stated year |
| Renovation in 5 years | Expense, one-off, at the stated year |
4. Add taxes and unexpected events
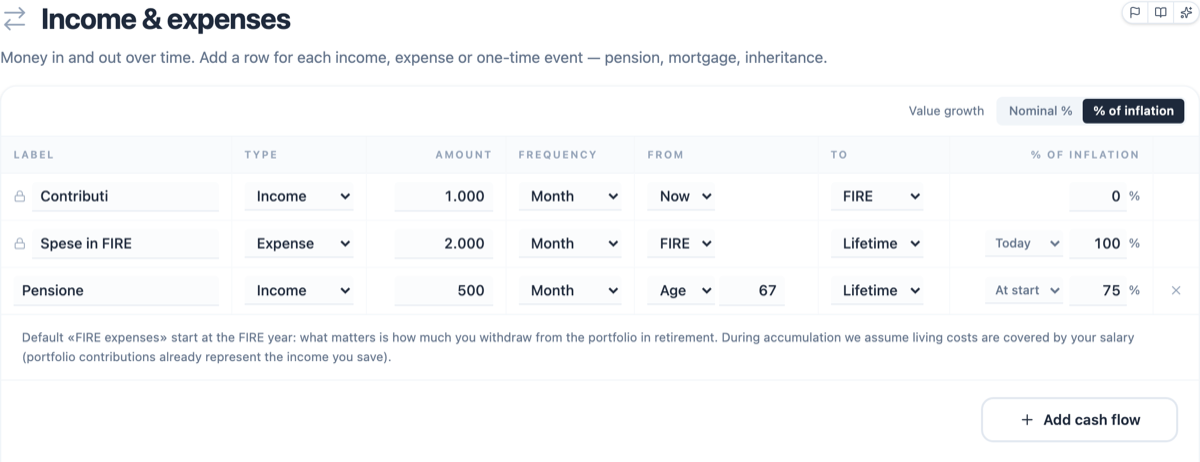
Capital gains tax (typically 26% in Italy) applies to withdrawals and to rebalancing that generates sales. Stamp duty is 0.2% a year on the portfolio total. Both bite every year, and over thirty-year horizons they are not a detail.
Unexpected events simulate rare extraordinary expenses, medical emergencies, for instance. You pick a severity from Light to Severe, which sets how many events occur and what percentage of capital each one withdraws. Event ages are drawn once and shared across all simulations, so comparisons stay comparable. They appear as amber markers on the charts.
5. Read the probability of success
The engine runs thousands of Monte Carlo simulations. A simulation is a success if the portfolio survives to the sampled age of death, a failure if it runs out first. The probability of success is the share of successful runs.
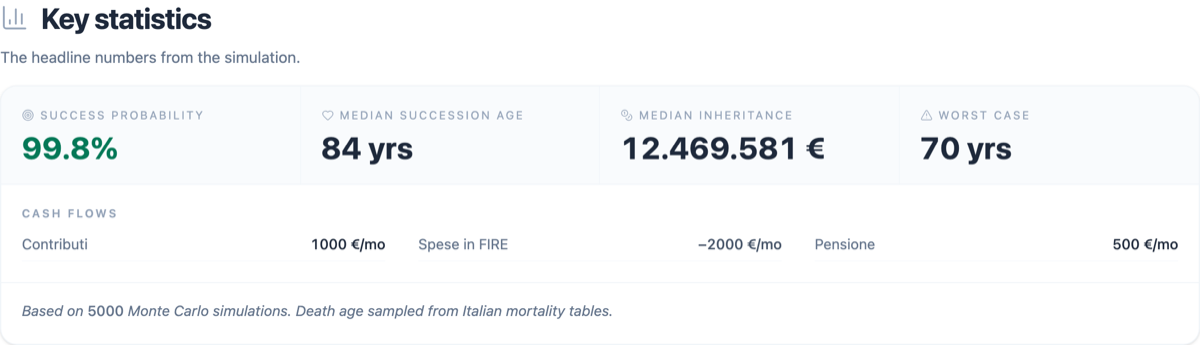
Sampling isn't month-by-month random: returns are drawn in continuous 3-year blocks from your portfolio's monthly history (block bootstrapping). This preserves serial correlation crisis sequences stay intact, with the consecutive months of decline and recovery typical of 2008 or COVID. It's the difference between simulating a plausible market and simulating noise.
There's no universal threshold. 100% usually means you're working longer than necessary; below 80% the plan depends too much on how the first years go. Many people settle around 90% and keep some flexibility on spending.
Going deeper
- How the simulation works: the engine in detail
- The parameters: every field, one by one
- FIRE charts: reading projection, failures and inheritance